3D BAG
application on roof information
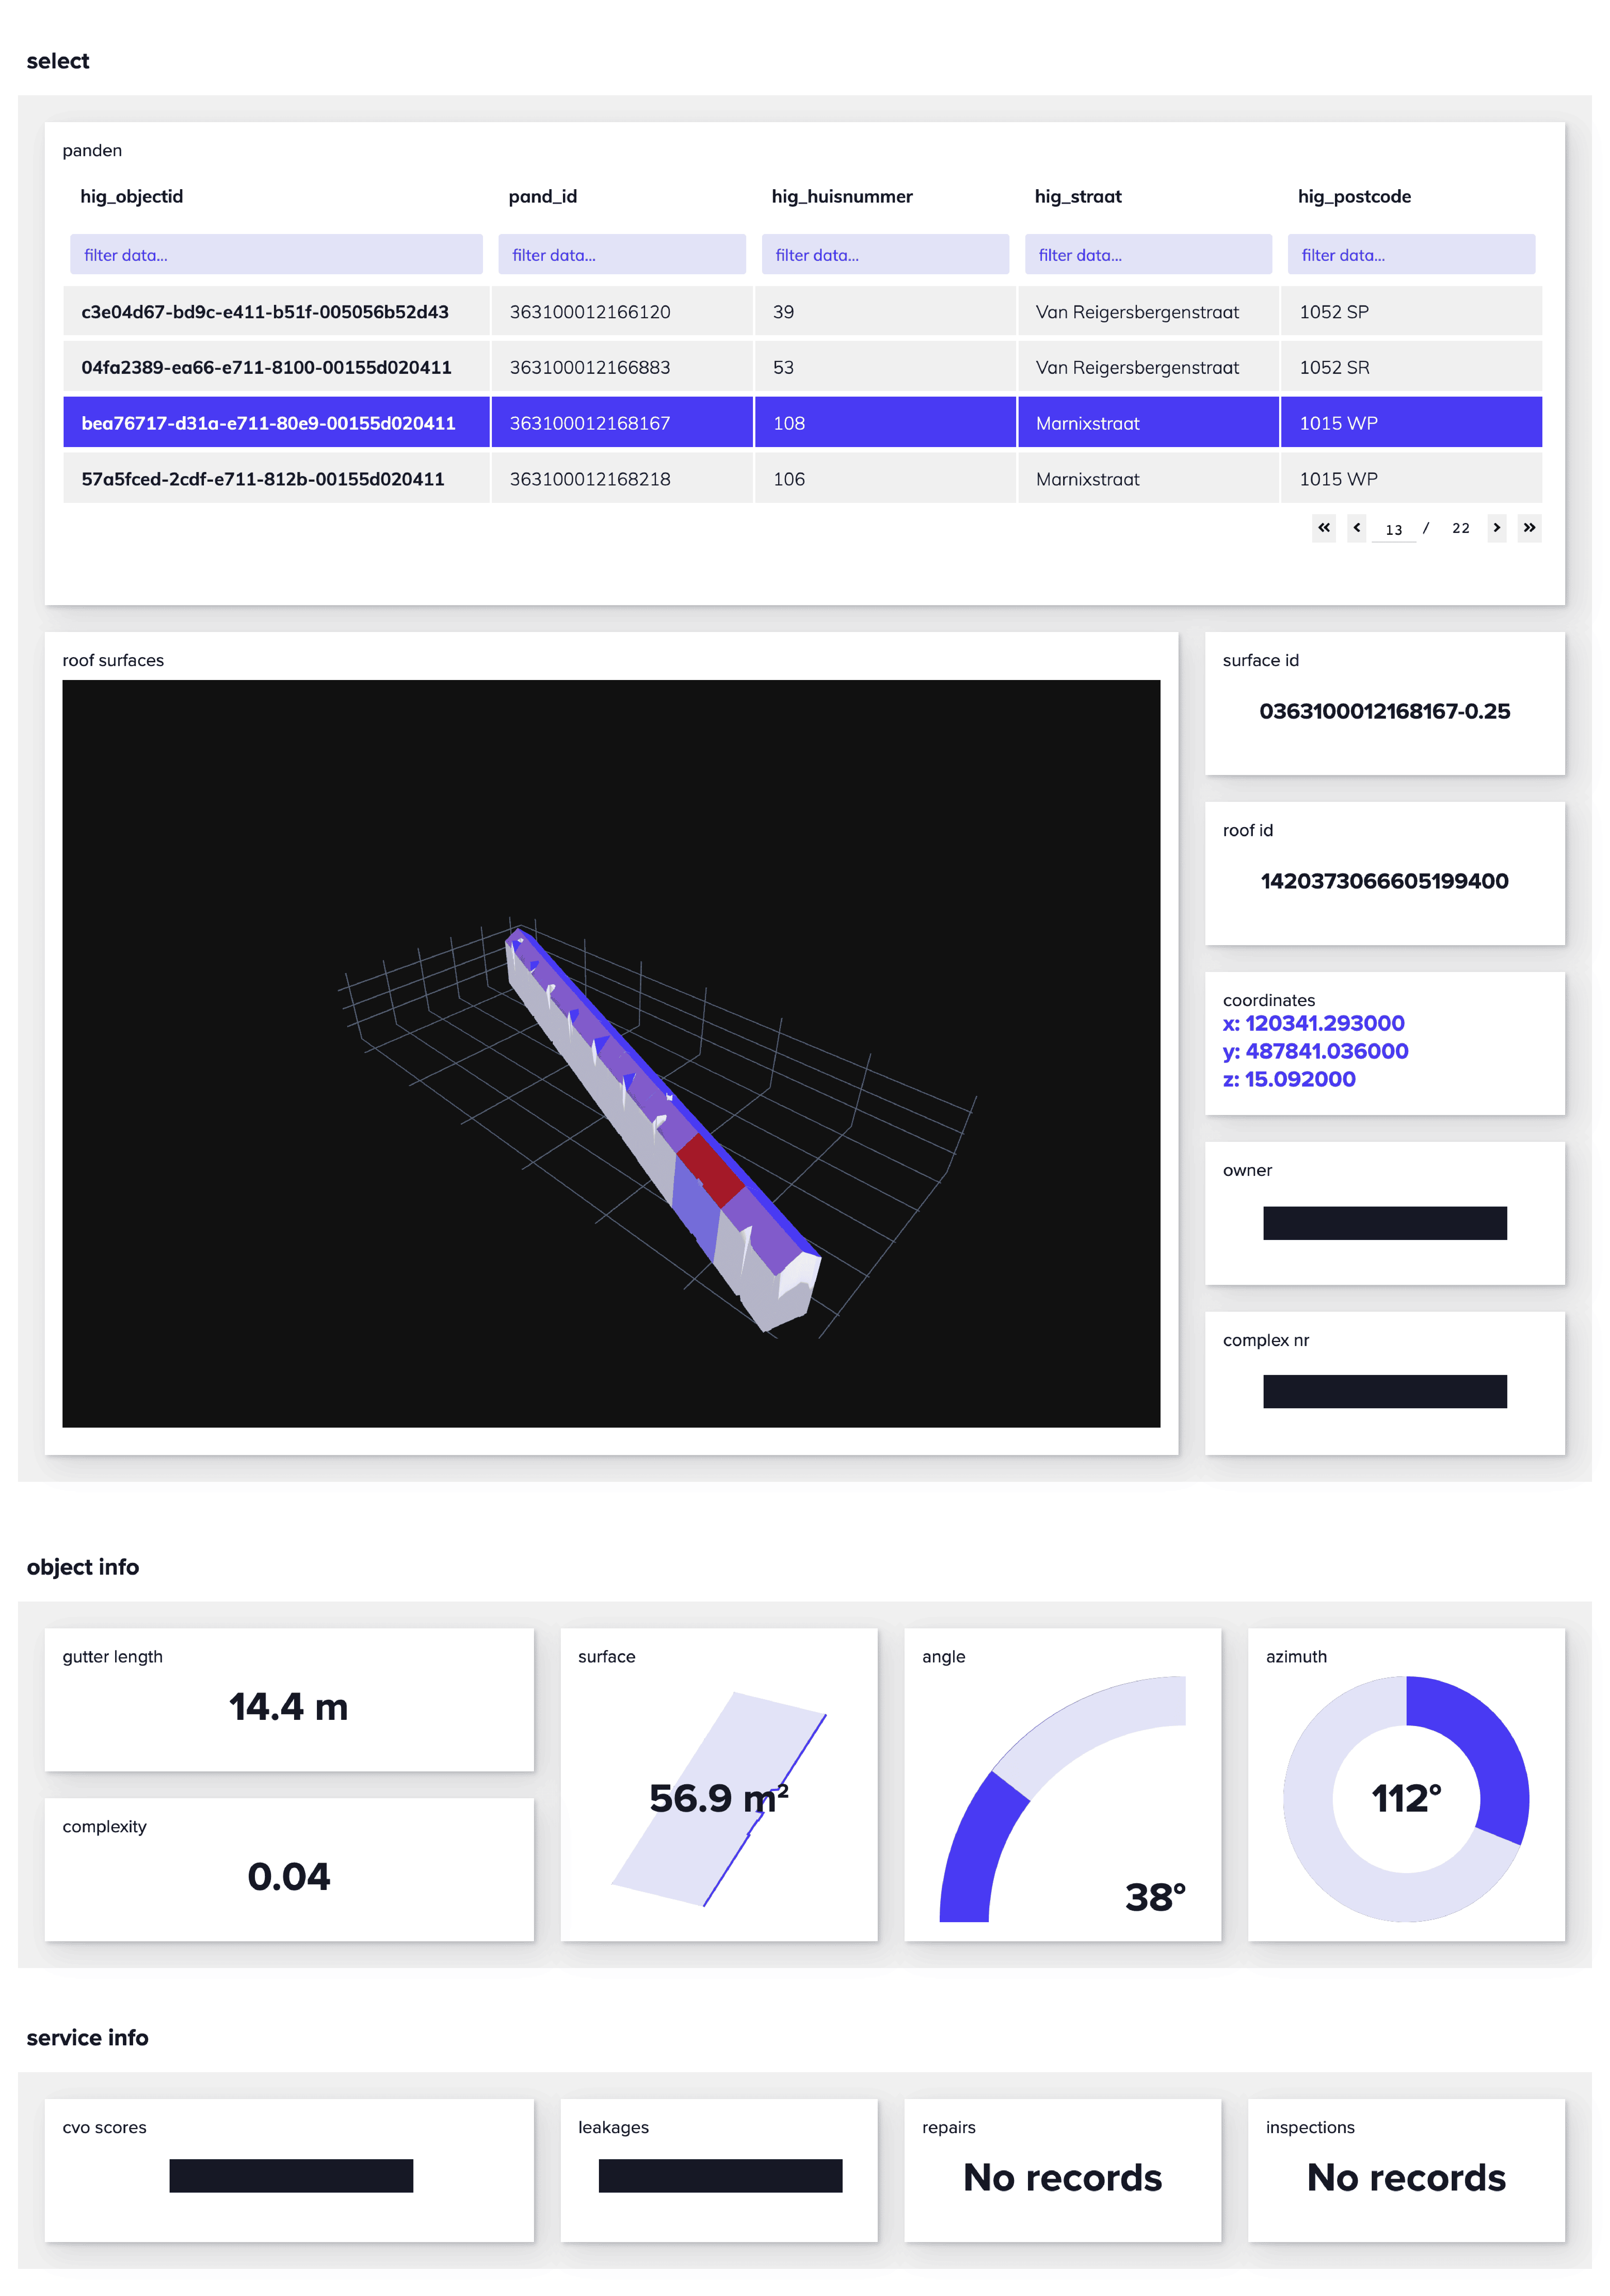
This app uses the BAG 3d building data and the 2.0 BAG addresses to demonstrate how valuable insights from roofs can be extracted thanks to this open source project.

info
- when one record of the datatable is clicked, the graph will respond by plotting its complex. The chosen building is in light blue
- within the plot, only roof surfaces are clickable
- the cards to the plot’s right side shows the building information and the clicked spot’s 3d coordinates queried from BAG api
- the clicked roof surface is coloured red and its information is reflected by the cards below. The roof surfaces that are connected to it (basically those that form the same surface) are coloured light purple
- the models are handled by CityJSON Python api; the geometries are processed by shapely
- built with Plotly Dash and deployed in Google App Engine