Sensor dashboard
sensor monitoring
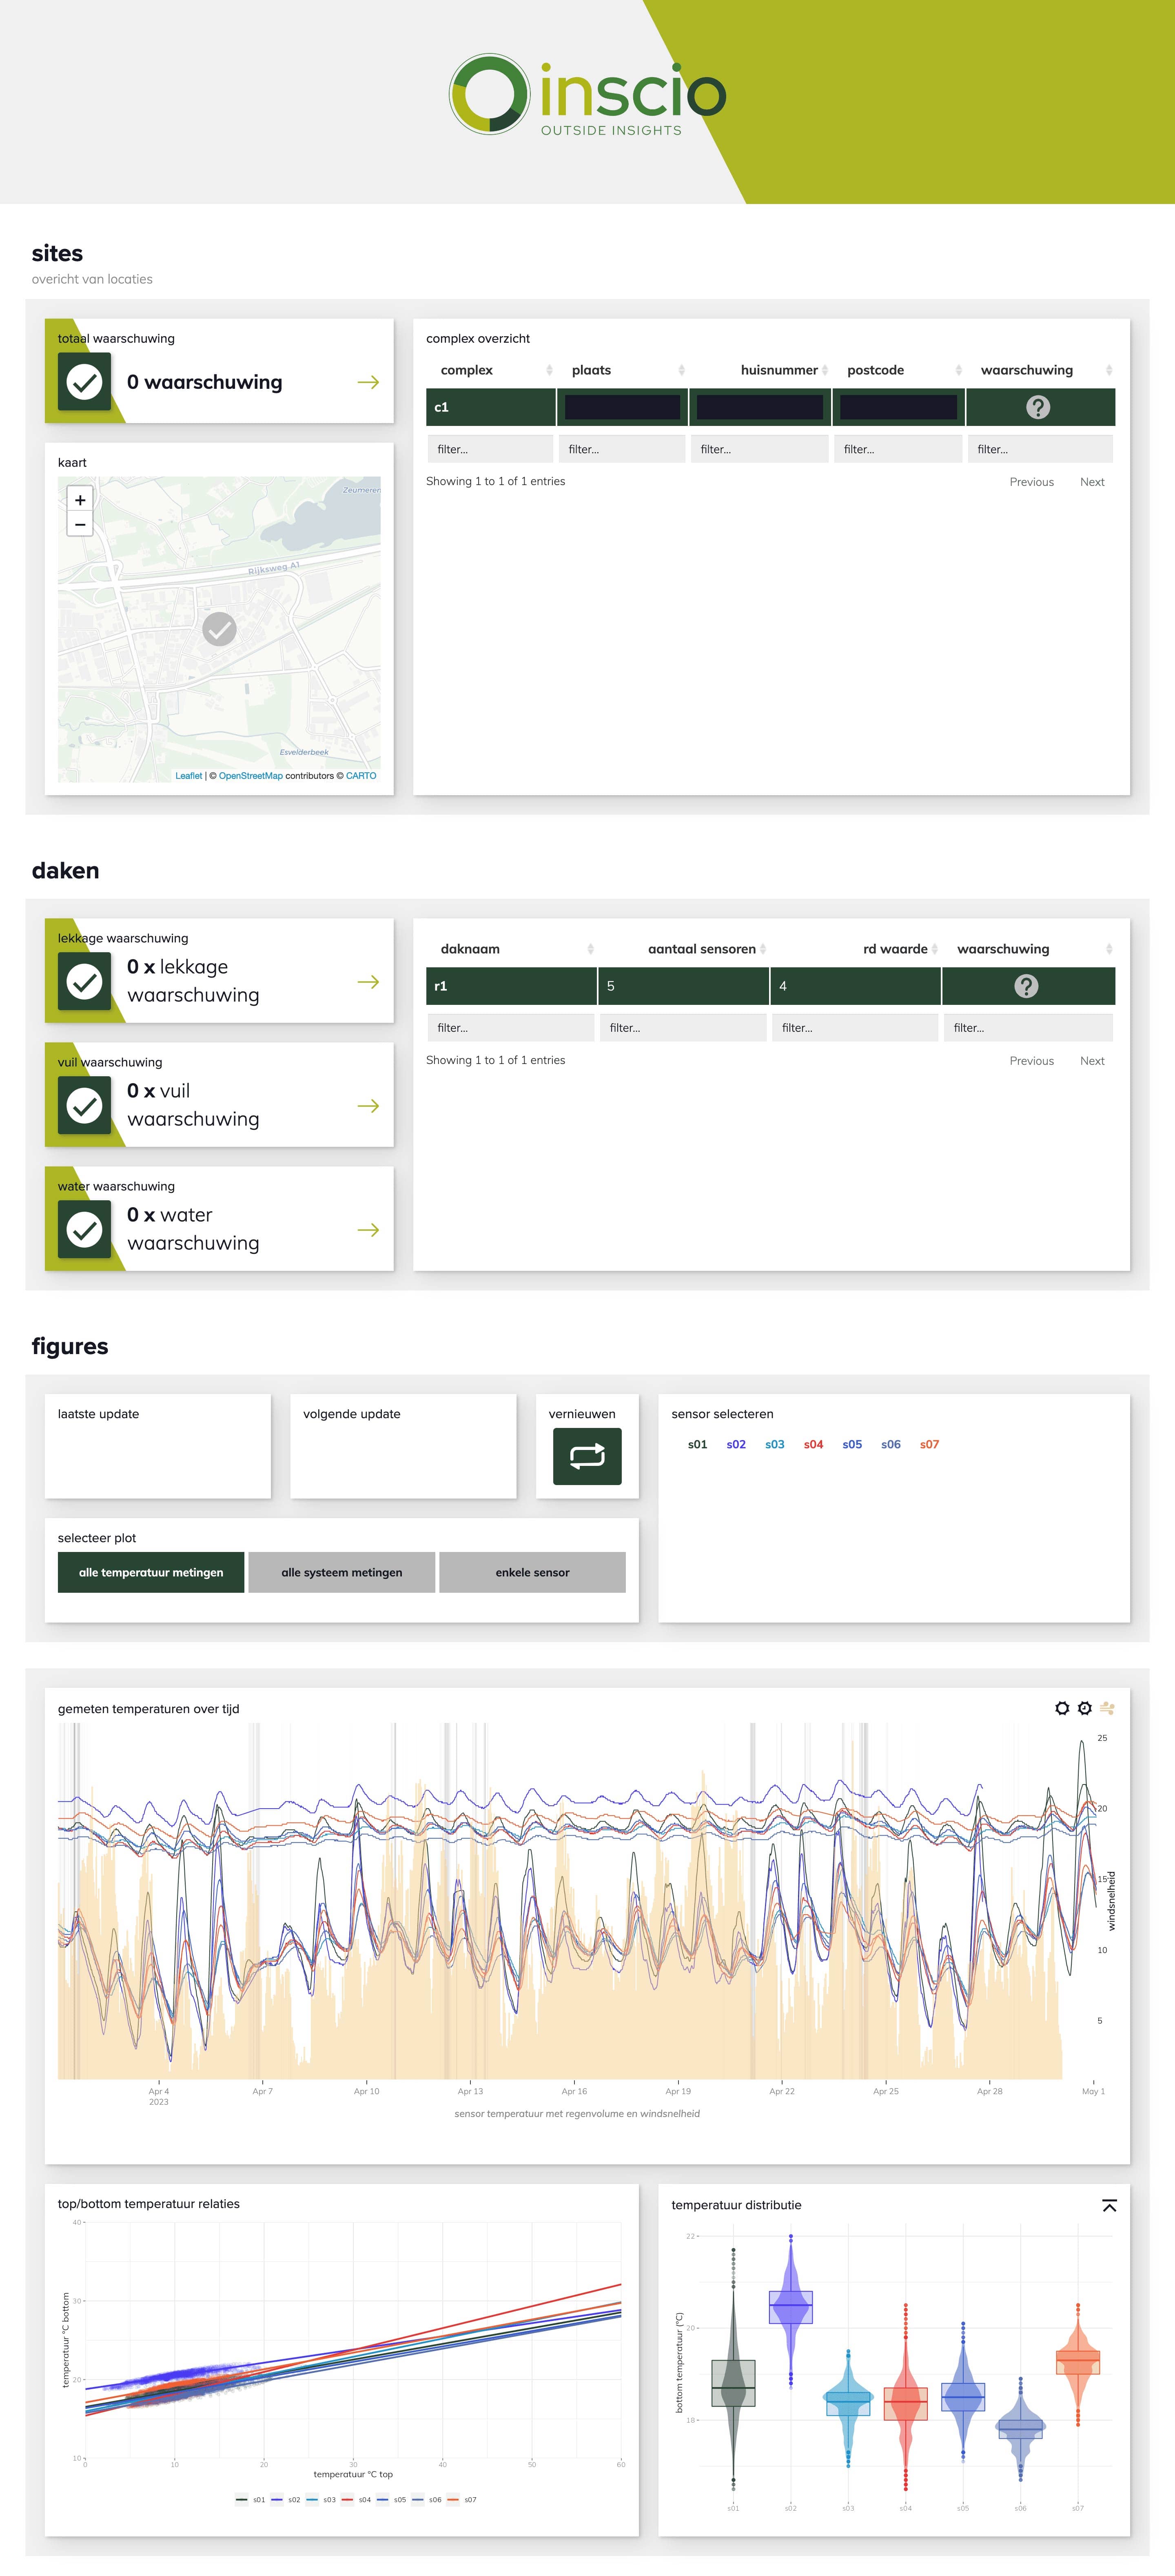
This responsive sensor dashboard is built to monitor roof temperature measurements of the current month.
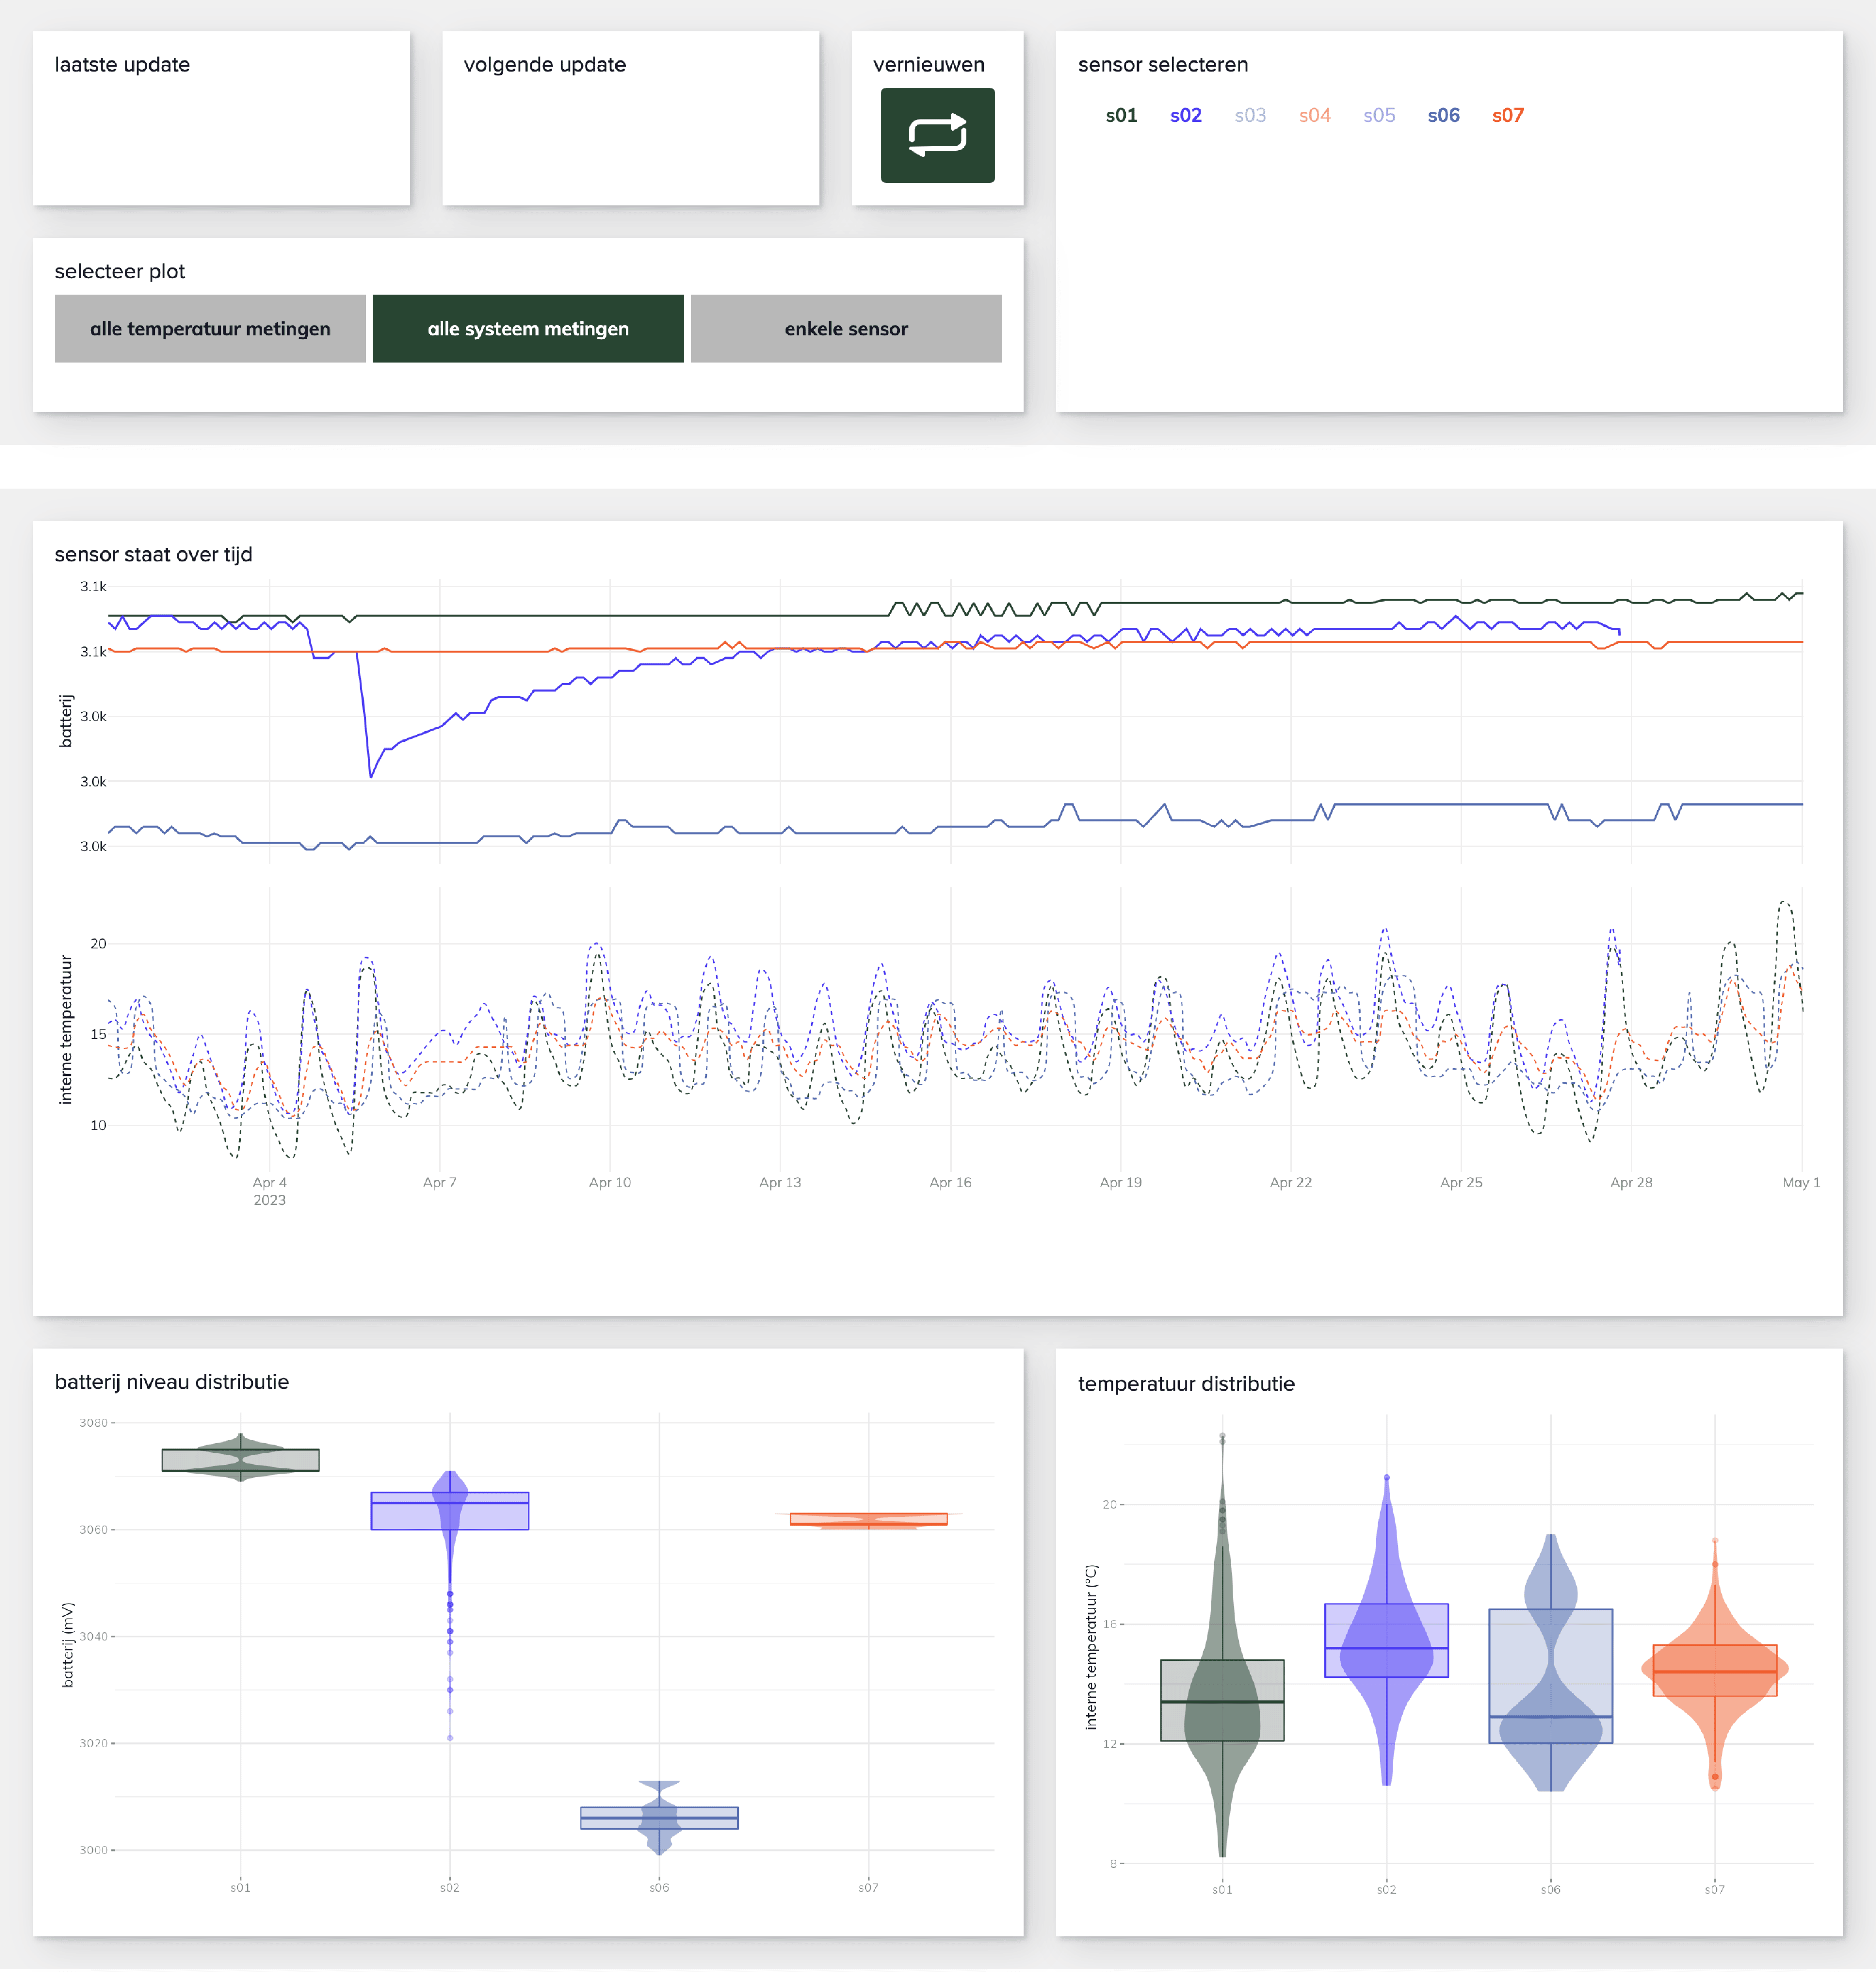
The graphs respond to the chosen roof from the chosen complex. System data (battery, inner temperature) are also available for
plotting. Their distributions are shown underneath.

info
- shown here is demo data
- the responsiveness goes from top down
- the first graph’s type responds to the card selecteer plot
- the gray rects behind demonstrate rain level by opacity
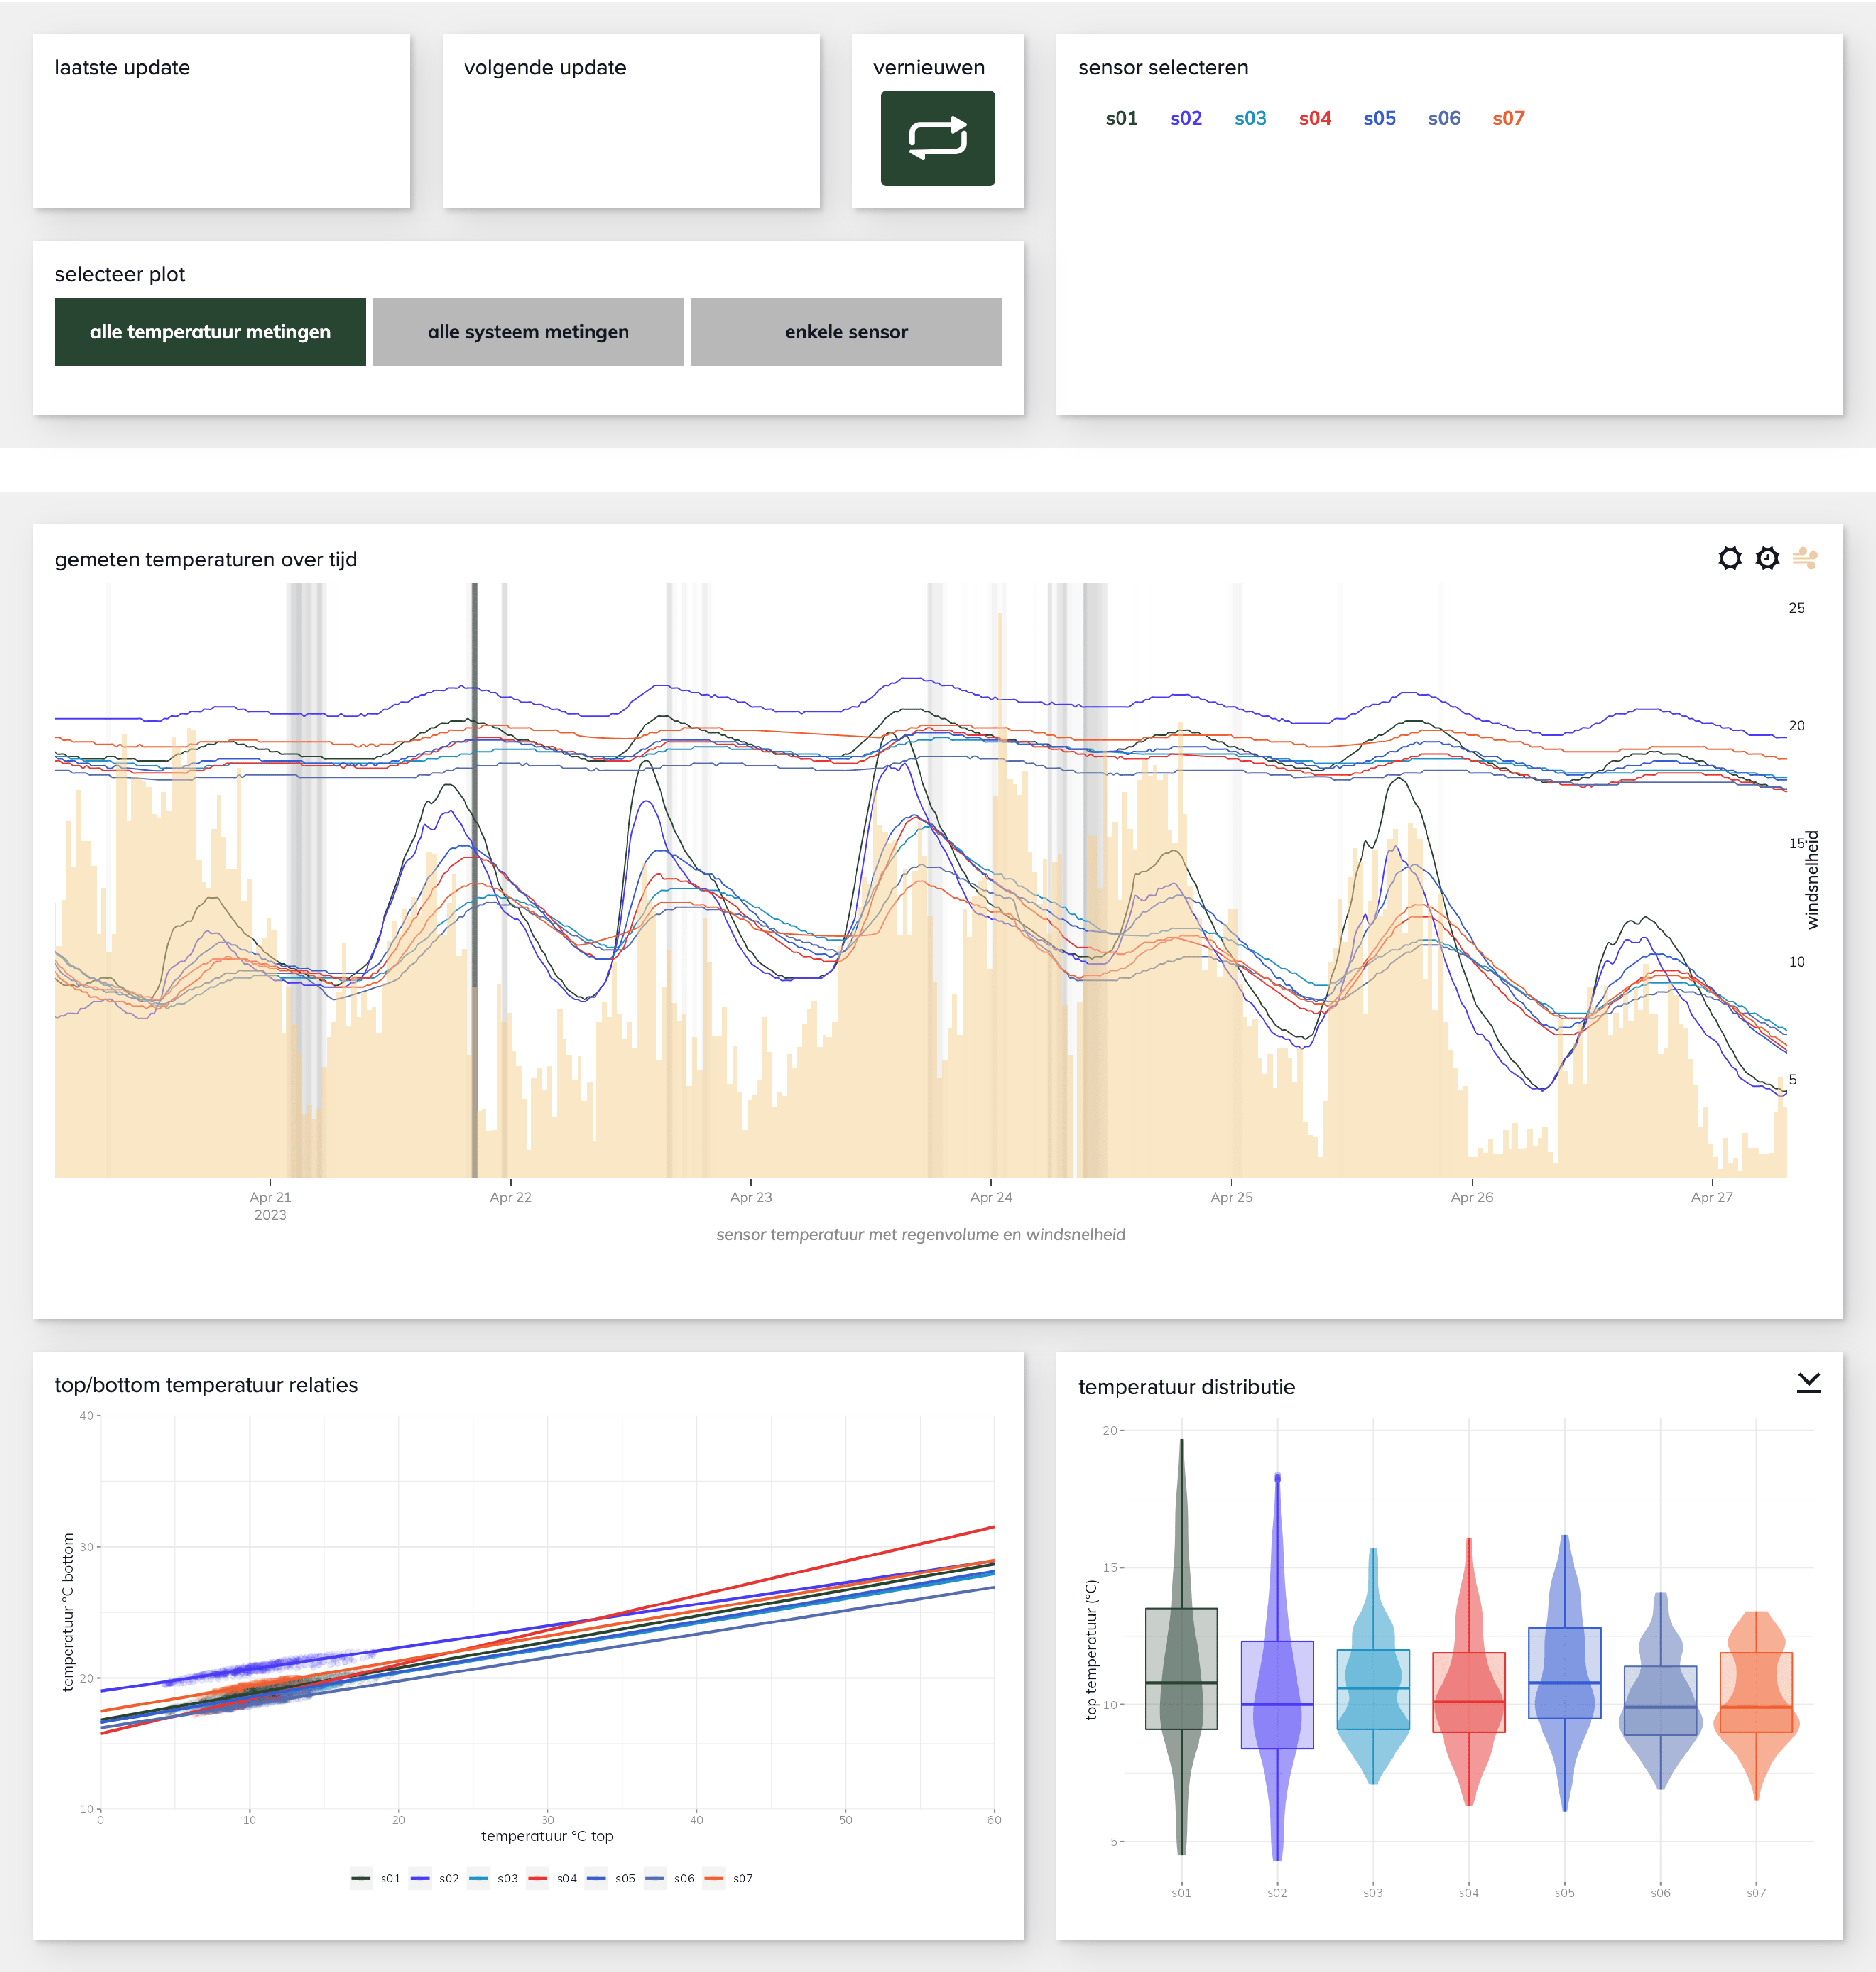
- the yellow bars show weather data (either sun, sun duration or wind - chosen by icons on the graph’s right top corner)
- the weather data is from the closest KNMI weather station (based on postcode)
- the graph can be zoomed to a specific date range
- deployed in RShiny
eg. below, wind speed is chosen as the weather attribute;
dates are restricted to 21st - 27th;
the temperature distribution graph shows top temperature distribution instead of the default bottom temperature

eg. below, system data is shown and 3 sensors are deselected to focus on the other 4

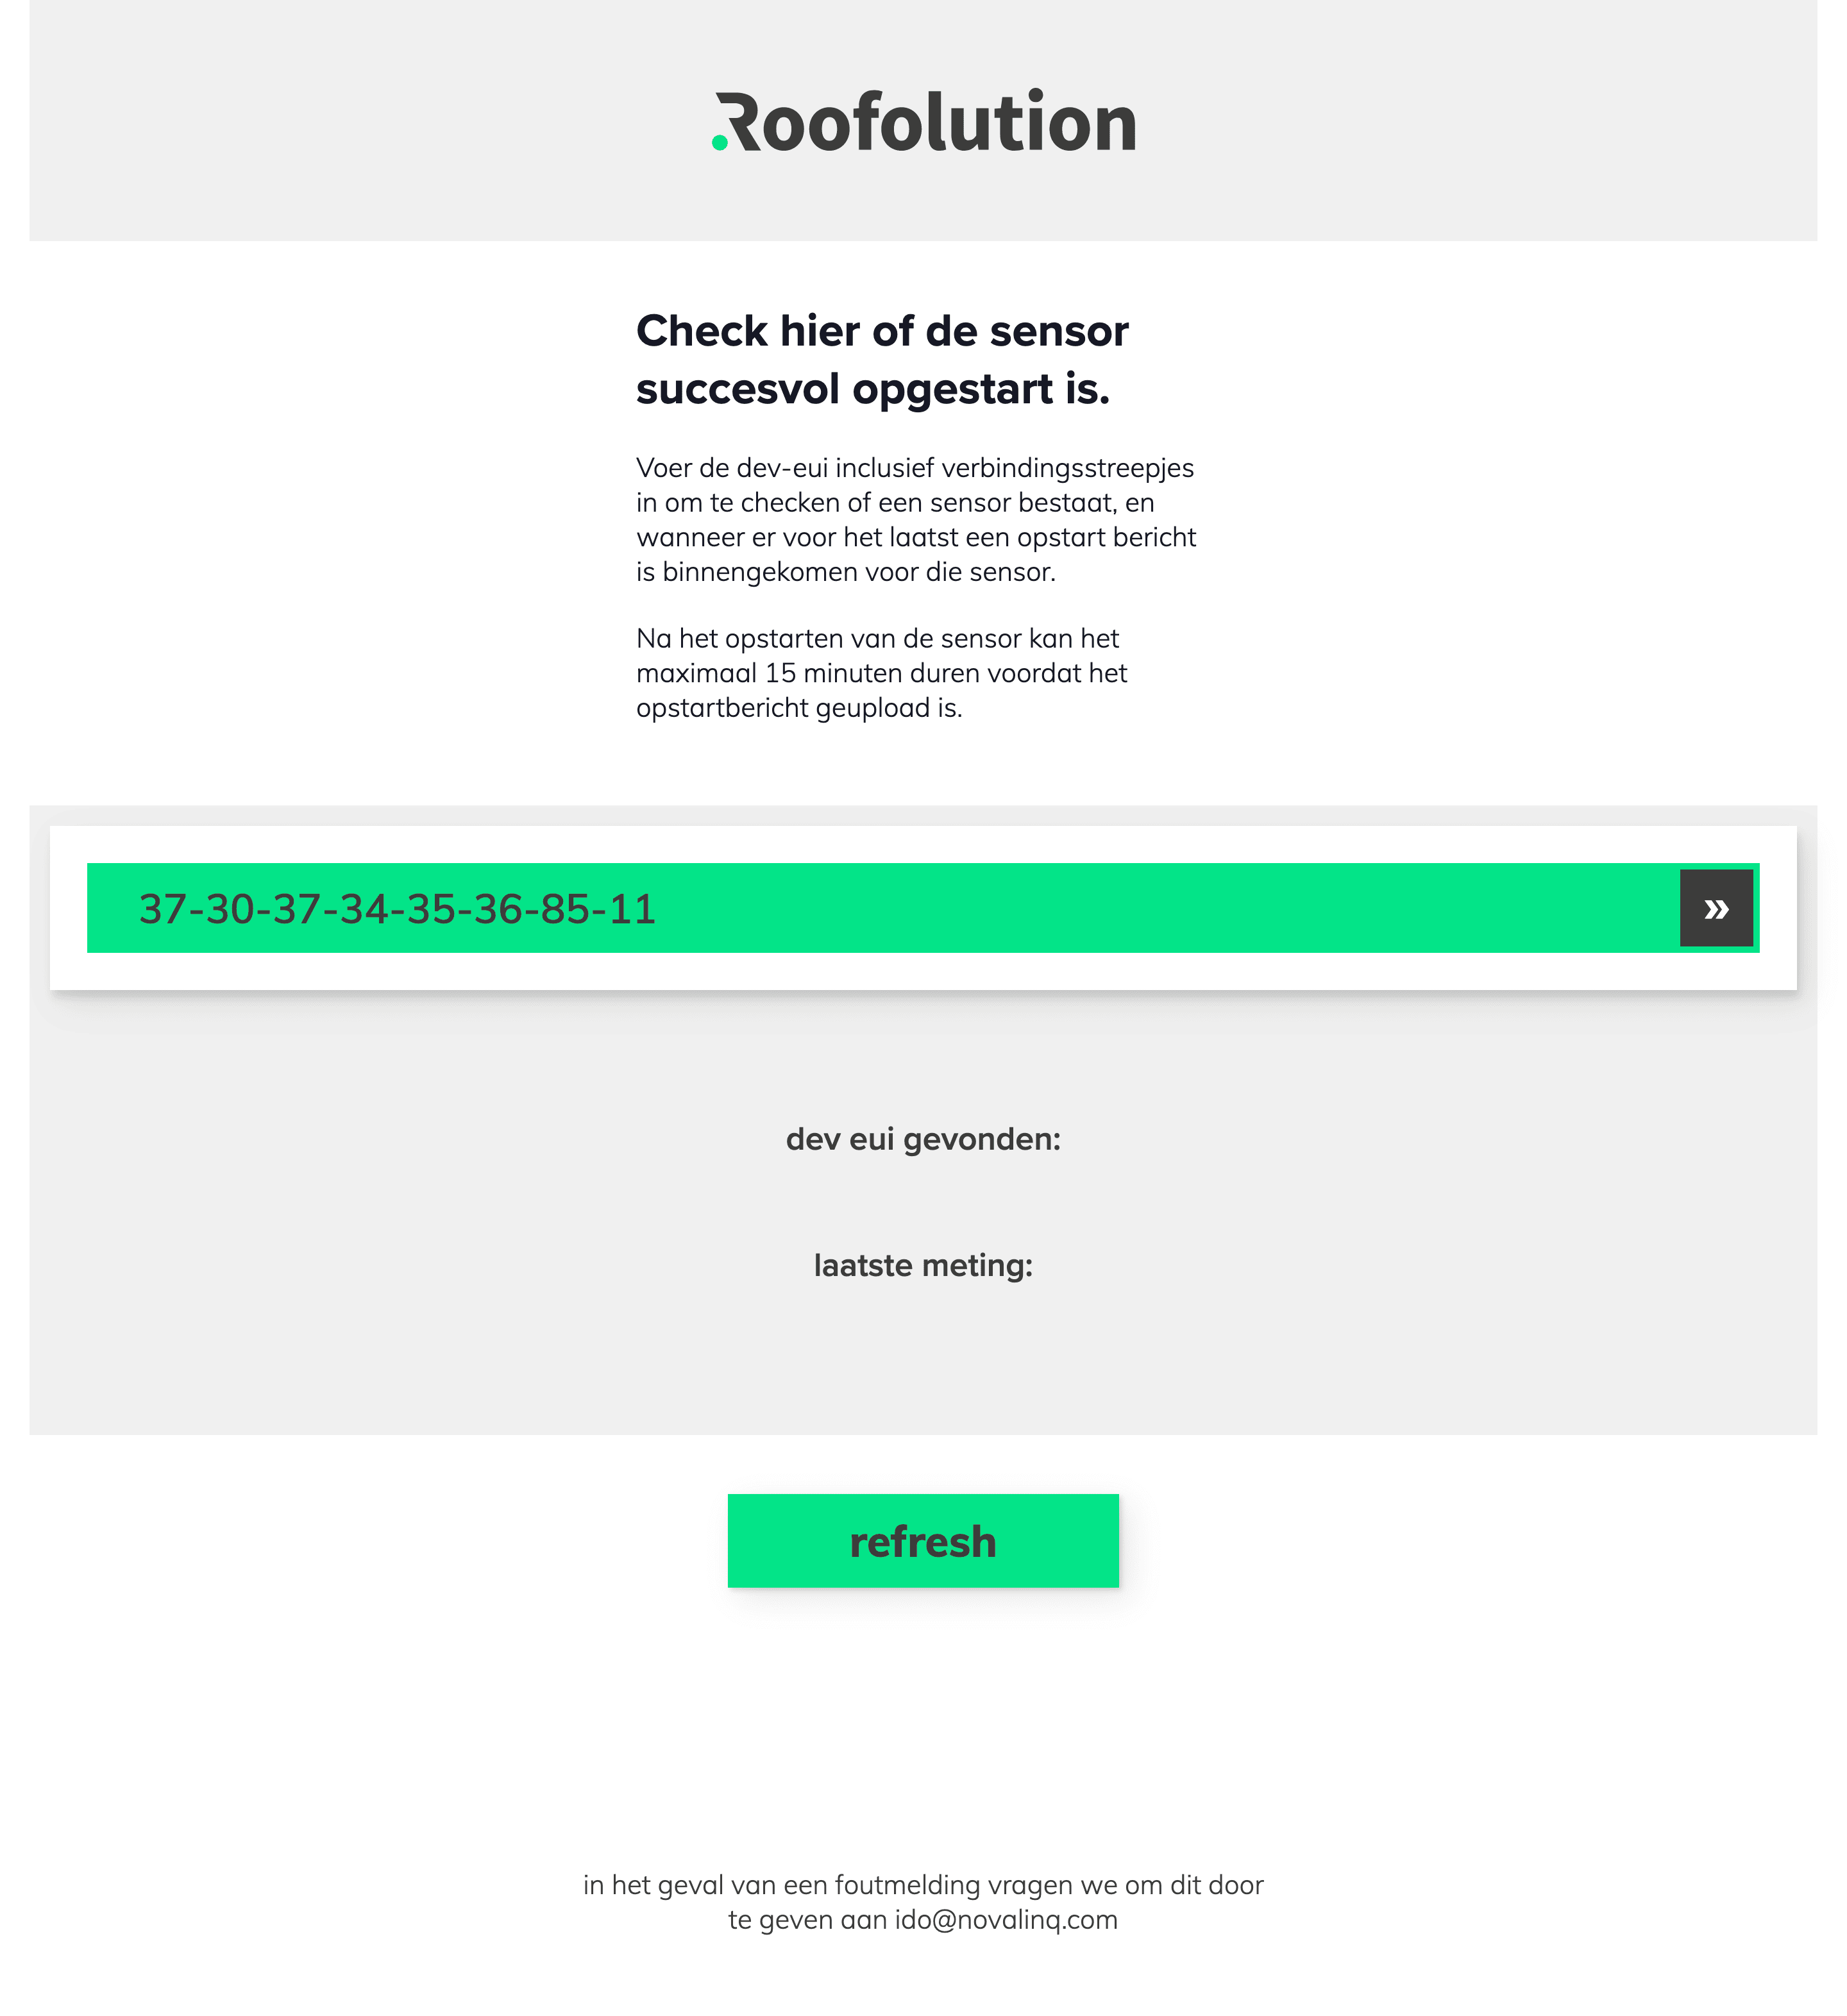
sensor check app
this app is used to do a live quick check for whether the sensor has been correctly started (if it sends a start-up message within 5 minutes)
